Performance
This page presents performance benchmarks for critical operations in
kmeanssa-ng. The generation of this document is automated and follows
these steps:
- Benchmark Execution: The performance benchmarks are executed
using
pytestwith thepytest-benchmarkplugin. This is done by running thepdm benchmark-allcommand, which saves the results in a JSON file. - Data Processing: A script then processes this raw benchmark
data, structuring it into the
docs-src/benchmark_data.jsonfile. This is handled by thescripts/generate_benchmark_docs.pyscript. - Documentation Rendering: Finally, the Quarto document
(
performance.qmd) is rendered to markdown. This document reads the data frombenchmark_data.jsonto generate the tables and plots you see on this page. The entire process is orchestrated by thepdm makedoccommand.
Benchmarks generated from: 0008_942b9e61fdd7a63974f0166f0dde37ea69843f39_20251028_073837_uncommited-changes.json
Robustification Strategies
The kmeanssa-ng library offers two main robustification strategies to improve the position of the centers at the end of the simulated annealing algorithm. Instead of keeping the last position of the centers, robustification analyzes the final steps of the simulation (e.g., the final 10%) to determine an optimal position.
Two robustification strategies are available:
MostFrequentNode: This strategy selects the most frequently visited node (position) during the final stages of the simulated annealing as the final center. It is a fast and effective approach if the centers converge to a stable position.MinimizeEnergy: This strategy searches for the position among those visited during the last steps that minimizes the system’s energy. This approach is more computationally expensive but can lead to better results by identifying more energetically stable center configurations. The energy can be calculated in two ways:uniform(the energy is calculated with respect to a uniform distribution on the nodes of the Quantum Graph) andobs(the energy is calculated using an empirical distribution based only on the observations, that is, the data points).
To optimize performance, MinimizeEnergy and its core component,
calculate_energy, are provided in two implementations:
- Pure Python: A readable and easy-to-understand version.
- Numba: A just-in-time (JIT) compiled version that provides a significant speedup for the computationally heavy parts of the algorithm. kmeanssa-ng will automatically use the Numba version if it is available.
The following table compares the different robustification strategies.
MostFrequentNode is used as the baseline reference (1.0x).
| Strategy | Implementation | Mode | Mean Time | Ratio vs. MostFrequentNode |
|---|---|---|---|---|
| MostFrequentNode | - | - | 75.53 µs | 1.0x |
| MinimizeEnergy | Numba | uniform | 887.46 µs | 11.75x (slower) |
| MinimizeEnergy | Numba | obs | 991.32 µs | 13.13x (slower) |
| MinimizeEnergy | Python | uniform | 21690.35 µs | 287.19x (slower) |
| MinimizeEnergy | Python | obs | 22403.76 µs | 296.64x (slower) |
The MinimizeEnergy strategy is significantly slower than
MostFrequentNode because it relies on the calculate_energy function,
which is computationally intensive. While calculate_energy is heavily
accelerated by Numba (see table below), MinimizeEnergy calls it
repeatedly within a loop (15 times for a 10% robustification with 150
observations).
This overhead, combined with other non-accelerated Python operations,
dilutes the overall performance gain. The Numba-accelerated version of
MinimizeEnergy is still 23-24x faster than its pure Python equivalent,
but the final speedup is lower than that of calculate_energy alone.
This reveals an algorithmic trade-off between solution quality and
computational complexity: while MinimizeEnergy produces higher-quality
clusterings than MostFrequentNode by optimizing center selection more
thoroughly, this improvement comes at a substantial increase in
computational expense.
The following table compares the performance of pure Python vs
Numba-accelerated implementations for the calculate_energy function:
| Method | Mode | Mean Time | Speedup vs. Python |
|---|---|---|---|
| Python | uniform |
4263.53 µs | 1.0x |
| Numba | uniform |
60.45 µs | 70.5x |
| Python | obs |
3866.39 µs | 1.0x |
| Numba | obs |
71.04 µs | 54.4x |
Detailed Benchmark Data
This section provides the raw performance data for all benchmarked operations, including mean, min, and max execution times.
Batch Distance Computation
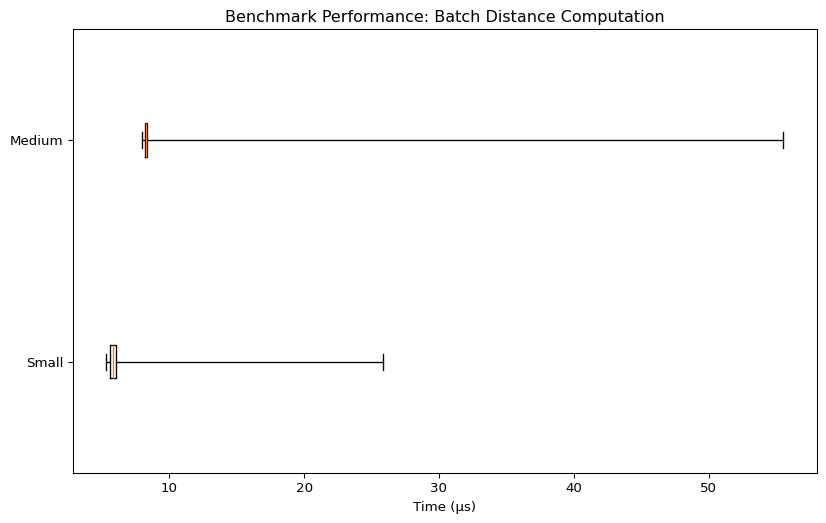
| Benchmark | Mean Time (µs) | Min Time (µs) | Max Time (µs) | Rounds |
|---|---|---|---|---|
| Small | 7.38 | 5.33 | 25.88 | 13 |
| Medium | 8.32 | 7.96 | 55.5 | 51282 |
Energy Calculation
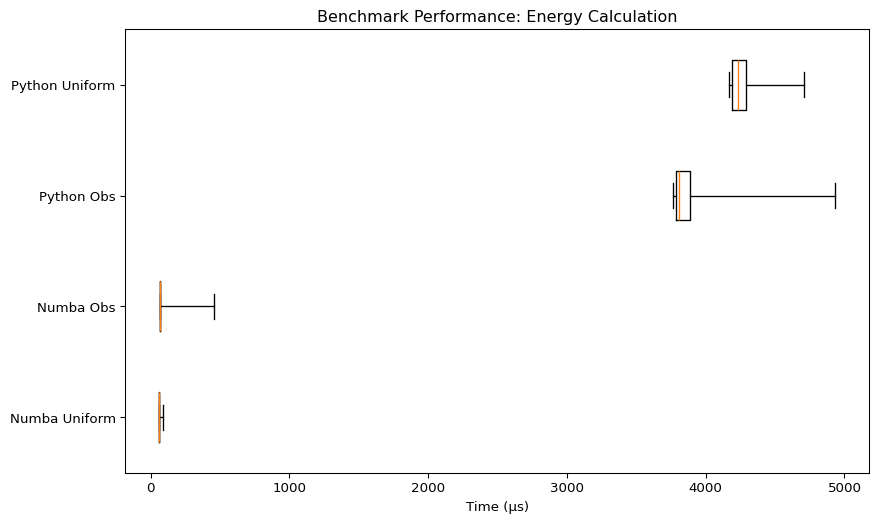
| Benchmark | Mean Time (µs) | Min Time (µs) | Max Time (µs) | Rounds |
|---|---|---|---|---|
| Numba Uniform | 60.45 | 59.83 | 89.29 | 14069 |
| Numba Obs | 71.04 | 66.37 | 460.58 | 529 |
| Python Obs | 3866.39 | 3764.29 | 4933.58 | 257 |
| Python Uniform | 4263.53 | 4169.83 | 4707.5 | 234 |
Graph Precomputing
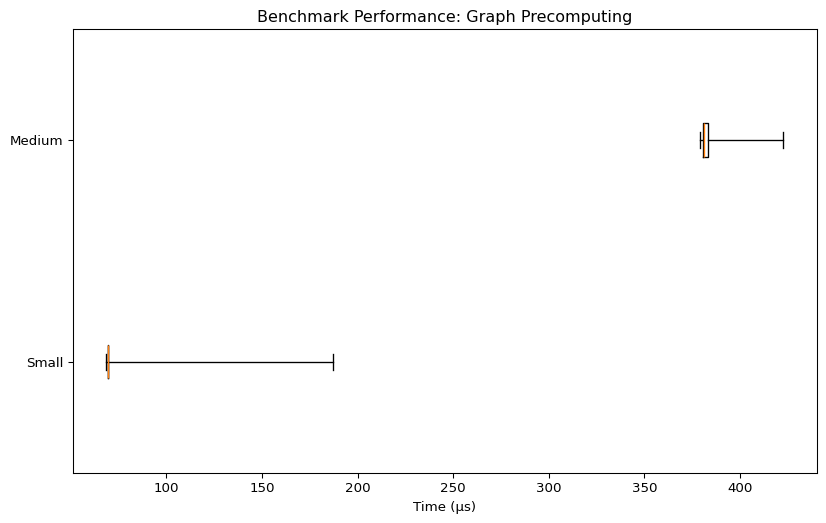
| Benchmark | Mean Time (µs) | Min Time (µs) | Max Time (µs) | Rounds |
|---|---|---|---|---|
| Small | 70.04 | 68.67 | 187.42 | 5577 |
| Medium | 382.28 | 379 | 422.33 | 2523 |
K-means++ Initialization
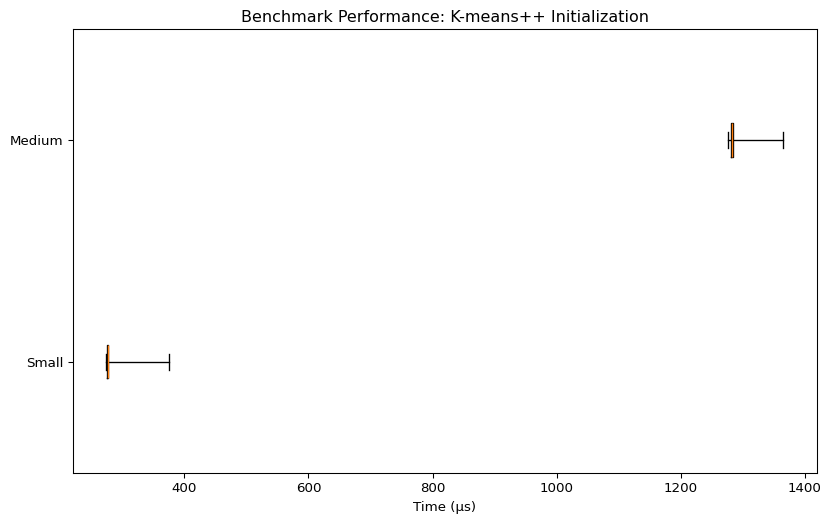
| Benchmark | Mean Time (µs) | Min Time (µs) | Max Time (µs) | Rounds |
|---|---|---|---|---|
| Small | 277.47 | 274.5 | 375.75 | 1891 |
| Medium | 1283.71 | 1276.17 | 1364.25 | 703 |
Robustification Strategies
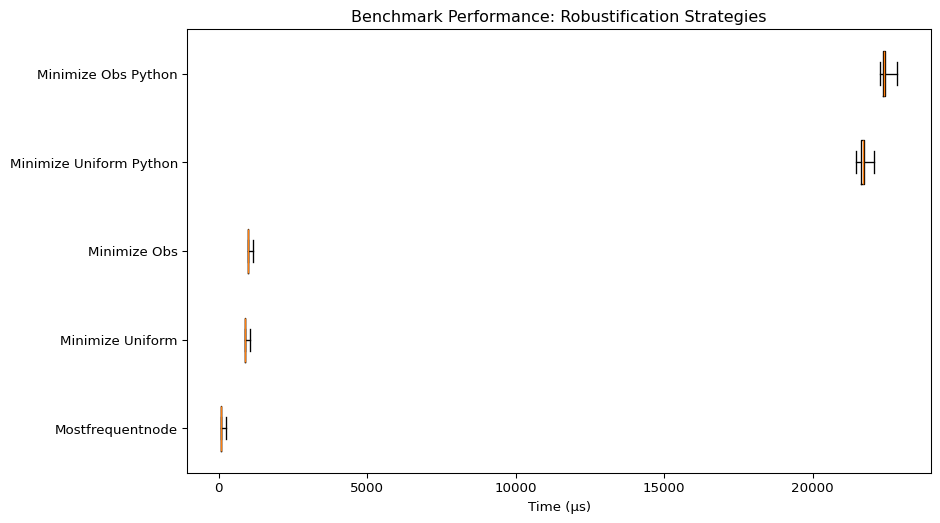
| Benchmark | Mean Time (µs) | Min Time (µs) | Max Time (µs) | Rounds |
|---|---|---|---|---|
| Mostfrequentnode | 75.53 | 72.67 | 240.46 | 8912 |
| Minimize Energy Uniform | 887.46 | 877.21 | 1037.54 | 1096 |
| Minimize Energy Obs | 991.32 | 981.08 | 1157.71 | 986 |
| Minimize Energy Uniform Python | 21690.3 | 21474.6 | 22081.1 | 46 |
| Minimize Energy Obs Python | 22403.8 | 22251.5 | 22851.9 | 45 |
Simulated Annealing
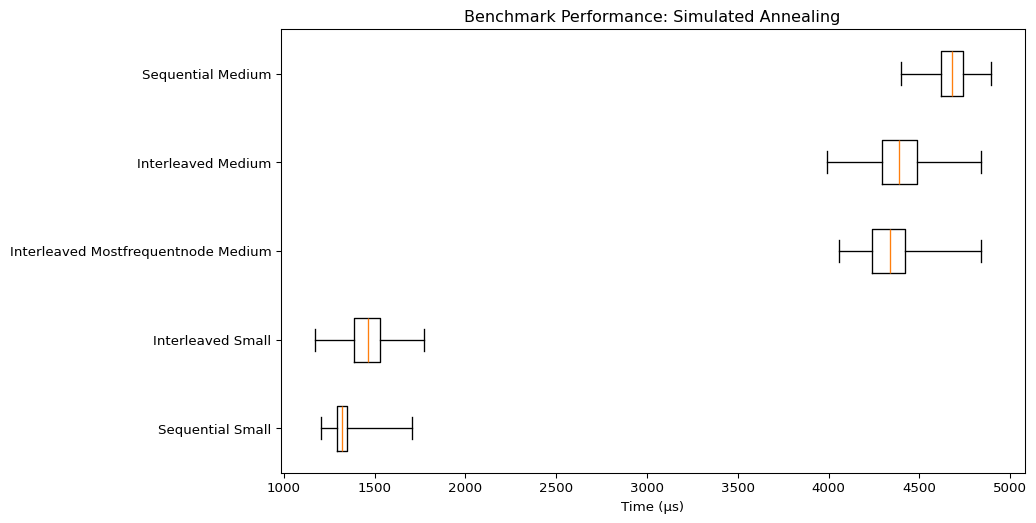
| Benchmark | Mean Time (µs) | Min Time (µs) | Max Time (µs) | Rounds |
|---|---|---|---|---|
| Sequential Small | 1318.44 | 1205.63 | 1706.79 | 738 |
| Interleaved Small | 1461.48 | 1168.5 | 1769.21 | 299 |
| Interleaved Mostfrequentnode Medium | 4341.57 | 4055.17 | 4840.63 | 213 |
| Interleaved Medium | 4390.18 | 3989.96 | 4841.08 | 222 |
| Sequential Medium | 4681 | 4397.58 | 4893.62 | 211 |